Marcus Beach Water Temperature
[better-ads type=’banner’ banner=’6711′ ]
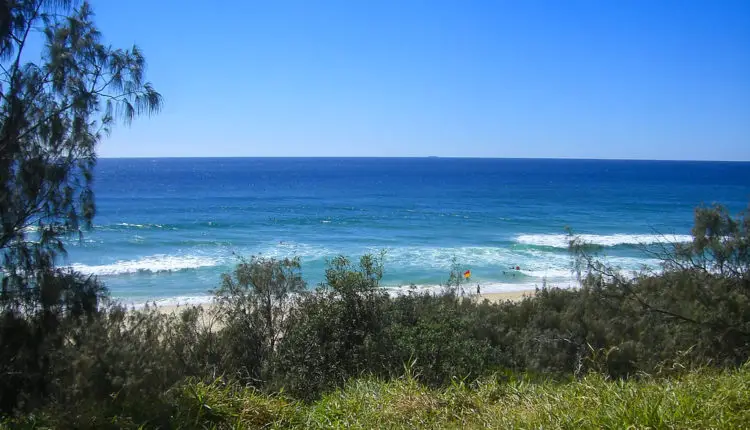
Marcus Beach is a village close to Coral Sea.
February is the month with the warmest water temperature at 80.4°F / 26.9°C.
The coolest month is August with an avg. water temperature of 70.5°F / 21.4°C.
July is the sunniest at 0in / 0mm and February the wettest month with 6in / 153.5mm.
The average air temperature is around 76.3°F / 24.6°C, January is the hottest month in a year. July is the coolest with 61°F / 16.1°C average air temperature.
mild temperate climate with hot summer would be the climate here.
January, March, April, November, December, June, July, August, September would be the best time to visit.
Marcus Beach Summary
| Description | Value |
|---|---|
| Current water temperature | / |
| Warmest Month Water Temperature: | February with 26.9°C / 80.4°F |
| Coldest Month Water Temperature: | August with 21.4°C / 70.5°F |
| Warmest Month Air Temperature: | January with 24.6°C / 76.3°F |
| Coldest Month Air Temperature: | July with 16.1°C / 61°F |
| Wettest Month: | February with 153.5mm / 6in |
| Driest Month: | July with 0mm / 0in |
| Highest Humidity | March with 78.8% |
| Lowest Humidity | August with 66.8% |
| Best Time to Visit: | January, March, April, November, December, June, July, August, September |
| Climate Classification | mild temperate climate with hot summer |
[better-ads type=’banner’ banner=’6738′ ]
Marcus Beach water temperature by month
Coral Sea water temperature by month
| Max. Water
Temperature (°C) |
ø. Water
Temperature (°C) |
Min. Water
Temperature (°C) |
|
|---|---|---|---|
|
January |
26.8 | 26.4 | 25.8 |
|
February |
27.1 | 26.8 | 26.6 |
|
March |
26.8 | 26.5 | 26.2 |
|
April |
26.3 | 25.7 | 25.1 |
|
May |
25.1 | 24.3 | 23.5 |
|
June |
23.5 | 22.8 | 21.9 |
|
July |
22.1 | 21.6 | 21.3 |
|
August |
21.6 | 21.4 | 21.2 |
|
September |
22.4 | 21.9 | 21.3 |
|
October |
23.4 | 22.8 | 22.3 |
|
November |
24.6 | 24 | 23.4 |
|
December |
25.8 | 25.3 | 24.4 |
Coral Sea water temperature by month
| Max. Water
Temperature (°F) |
ø. Water
Temperature (°F) |
Min. Water
Temperature (°F) |
|
|---|---|---|---|
|
January |
80.2 | 79.5 | 78.4 |
|
February |
80.8 | 80.2 | 79.9 |
|
March |
80.2 | 79.7 | 79.2 |
|
April |
79.3 | 78.3 | 77.2 |
|
May |
77.2 | 75.7 | 74.3 |
|
June |
74.3 | 73 | 71.4 |
|
July |
71.8 | 70.9 | 70.3 |
|
August |
70.9 | 70.5 | 70.2 |
|
September |
72.3 | 71.4 | 70.3 |
|
October |
74.1 | 73 | 72.1 |
|
November |
76.3 | 75.2 | 74.1 |
|
December |
78.4 | 77.5 | 75.9 |
February is the month with the highest water temperature at 80.4°F / 26.9°C.
The month with the lowest is August with an average water temperature of 70.5°F / 21.4°C.
[better-ads type=’banner’ banner=’7369′ ]
Marcus Beach weather today & 14-day weather forecast
|
|
|
|
|
|
|
Rel. Humidity |
|---|---|---|---|---|---|---|
|
|
Few clouds
|
|
|
|
|
|
|
|
Few clouds
|
|
|
|
|
|
|
|
Few clouds
|
|
|
|
|
|
|
|
Few clouds
|
|
|
|
|
|
|
|
Clear Sky
|
|
|
|
|
|
|
|
Few clouds
|
|
|
|
|
|
|
|
Few clouds
|
|
|
|
|
|
|
|
|
|
|
|
|
Rel. Humidity |
|---|---|---|---|---|---|---|
|
|
Light rain
|
|
|
|
|
|
|
|
Light rain
|
|
|
|
|
|
|
|
Light rain
|
|
|
|
|
|
|
|
Light rain
|
|
|
|
|
|
|
|
Light rain
|
|
|
|
|
|
|
|
Broken clouds
|
|
|
|
|
|
|
|
Light rain
|
|
|
|
|
|
|
|
Thunderstorm with rain
|
|
|
|
|
|
|
|
Light rain
|
|
|
|
|
|
Marcus Beach weather by month / climate table
Max. Temperature °C | ø. Temperature °C | Min. Temperature (°C) |
Precip. (mm) |
Rainy Days (d) |
Rel. Humidity (%) |
|
|---|---|---|---|---|---|---|
|
January |
28.8 | 24.6 | 21.9 | 84.8 | 6 | 76.3% |
|
February |
28.3 | 24.4 | 22 | 153.5 | 11 | 78.4% |
|
March |
27.3 | 23.6 | 20.4 | 134.2 | 18 | 78.8% |
|
April |
25.1 | 21.5 | 18 | 52.3 | 9 | 77.8% |
|
May |
23.1 | 18.9 | 14.5 | 15.4 | 3 | 74.4% |
|
June |
20.9 | 16.8 | 12.9 | 2.5 | 1 | 74.6% |
|
July |
20.8 | 16.1 | 12.5 | 0 | 0 | 70.4% |
|
August |
21.8 | 17 | 12.7 | 3.9 | 0 | 66.8% |
|
September |
25.4 | 19.3 | 15.1 | 0 | 0 | 68.5% |
|
October |
27 | 21.1 | 16.7 | 8.3 | 0 | 70.4% |
|
November |
27.4 | 22.6 | 19 | 24.6 | 1 | 71.2% |
|
December |
28.7 | 24 | 20.6 | 55.5 | 2 | 73% |
Max. Temperature °F | ø. Temperature °F | Min. Temperature (°F) |
Precip. (in) |
Rainy Days (d) |
Rel. Humidity (%) |
|
|---|---|---|---|---|---|---|
|
January |
83.8 | 76.3 | 71.4 | 3.3 | 6 | 76.3% |
|
February |
82.9 | 75.9 | 71.6 | 6 | 11 | 78.4% |
|
March |
81.1 | 74.5 | 68.7 | 5.3 | 18 | 78.8% |
|
April |
77.2 | 70.7 | 64.4 | 2.1 | 9 | 77.8% |
|
May |
73.6 | 66 | 58.1 | 0.6 | 3 | 74.4% |
|
June |
69.6 | 62.2 | 55.2 | 0.1 | 1 | 74.6% |
|
July |
69.4 | 61 | 54.5 | 0 | 0 | 70.4% |
|
August |
71.2 | 62.6 | 54.9 | 0.2 | 0 | 66.8% |
|
September |
77.7 | 66.7 | 59.2 | 0 | 0 | 68.5% |
|
October |
80.6 | 70 | 62.1 | 0.3 | 0 | 70.4% |
|
November |
81.3 | 72.7 | 66.2 | 1 | 1 | 71.2% |
|
December |
83.7 | 75.2 | 69.1 | 2.2 | 2 | 73% |
July is the most draught at 0in / 0mm and February the month with the most rain around 6in / 153.5mm.
The avg. temperature is around 76.3°F / 24.6°C, January is the hottest month in a year. July is the coolest with 61°F / 16.1°C avg. temperature.