Ḷḷuarca Water Temperature

[better-ads type=’banner’ banner=’6711′ ]
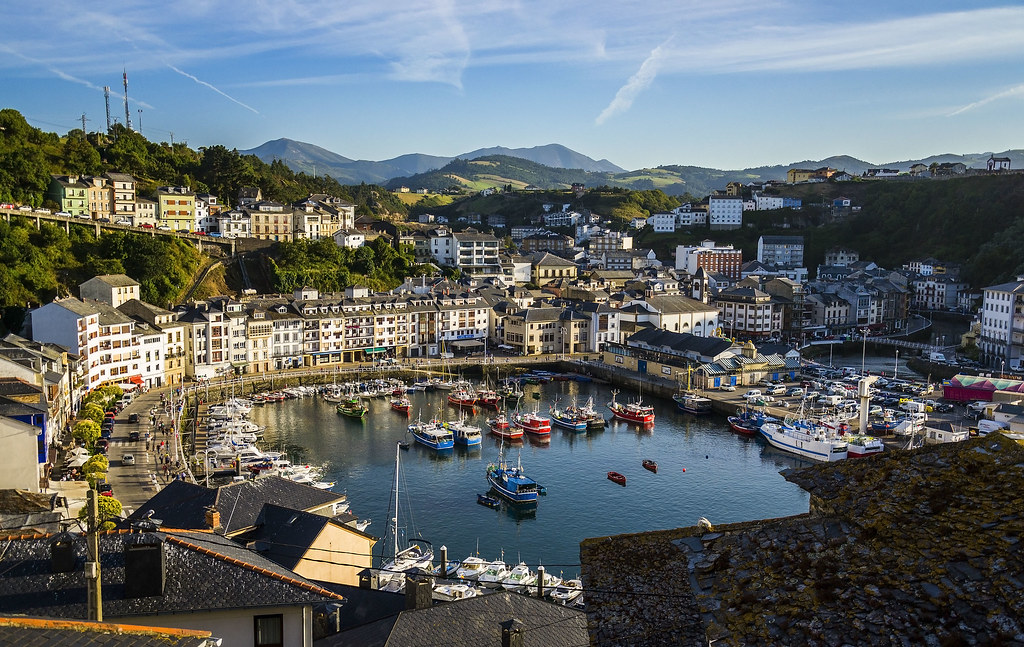
Ḷḷuarca is a town close to Bay of Biscay.
August is the month with the highest water temperature at 69.3°F / 20.7°C.
The coldest month is March with an average water temperature of 54.5°F / 12.5°C.
February is the driest at 0.4in / 10.5mm and November the wettest month with 4.7in / 119.2mm.
With an average air temperature of 64.8°F / 18.2°C, August is the warmest month in a year. February is the coldest with 45.7°F / 7.6°C average air temperature.
The Climate is described as temperate climate with warm and dry summer. Best time to Visit would be in June, July, August, September.
Ḷḷuarca Summary
| Description | Value |
|---|---|
| Current water temperature | / |
| Warmest Month Water Temperature: | August with 20.7°C / 69.3°F |
| Coldest Month Water Temperature: | March with 12.5°C / 54.5°F |
| Warmest Month Air Temperature: | August with 18.2°C / 64.8°F |
| Coldest Month Air Temperature: | February with 7.6°C / 45.7°F |
| Wettest Month: | November with 119.2mm / 4.7in |
| Driest Month: | February with 10.5mm / 0.4in |
| Highest Humidity | June with 82.2% |
| Lowest Humidity | March with 77.8% |
| Best Time to Visit: | June, July, August, September |
| Climate Classification | temperate climate with warm and dry summer |
[better-ads type=’banner’ banner=’6738′ ]
Ḷḷuarca water temperature by month
Bay of Biscay water temperature by month
| Max. Water
Temperature (°C) |
ø. Water
Temperature (°C) |
Min. Water
Temperature (°C) |
|
|---|---|---|---|
|
January |
13.7 | 13.3 | 12.9 |
|
February |
13 | 12.7 | 12.4 |
|
March |
12.7 | 12.6 | 12.4 |
|
April |
13.8 | 13.2 | 12.6 |
|
May |
16 | 14.7 | 13.8 |
|
June |
18.5 | 17.2 | 16 |
|
July |
20.5 | 19.5 | 18.5 |
|
August |
20.9 | 20.7 | 20.5 |
|
September |
20.6 | 19.9 | 19.2 |
|
October |
19.2 | 18.2 | 17.1 |
|
November |
17 | 15.8 | 14.8 |
|
December |
14.8 | 14.2 | 13.7 |
Bay of Biscay water temperature by month
| Max. Water
Temperature (°F) |
ø. Water
Temperature (°F) |
Min. Water
Temperature (°F) |
|
|---|---|---|---|
|
January |
56.7 | 55.9 | 55.2 |
|
February |
55.4 | 54.9 | 54.3 |
|
March |
54.9 | 54.7 | 54.3 |
|
April |
56.8 | 55.8 | 54.7 |
|
May |
60.8 | 58.5 | 56.8 |
|
June |
65.3 | 63 | 60.8 |
|
July |
68.9 | 67.1 | 65.3 |
|
August |
69.6 | 69.3 | 68.9 |
|
September |
69.1 | 67.8 | 66.6 |
|
October |
66.6 | 64.8 | 62.8 |
|
November |
62.6 | 60.4 | 58.6 |
|
December |
58.6 | 57.6 | 56.7 |
The warmest water temperature are in August with around 69.3°F / 20.7°C.
The coldest in March with an average water temperature of 54.5°F / 12.5°C.
[better-ads type=’banner’ banner=’7369′ ]
Ḷḷuarca weather today & 14-day weather forecast
|
|
|
|
|
|
|
Rel. Humidity |
|---|---|---|---|---|---|---|
|
|
Scattered clouds
|
|
|
|
|
|
|
|
Light rain
|
|
|
|
|
|
|
|
Heavy rain
|
|
|
|
|
|
|
|
Light shower rain
|
|
|
|
|
|
|
|
Light rain
|
|
|
|
|
|
|
|
Few clouds
|
|
|
|
|
|
|
|
Few clouds
|
|
|
|
|
|
|
|
|
|
|
|
|
Rel. Humidity |
|---|---|---|---|---|---|---|
|
|
Scattered clouds
|
|
|
|
|
|
|
|
Overcast clouds
|
|
|
|
|
|
|
|
Few clouds
|
|
|
|
|
|
|
|
Few clouds
|
|
|
|
|
|
|
|
Light shower rain
|
|
|
|
|
|
|
|
Light shower rain
|
|
|
|
|
|
|
|
Light shower rain
|
|
|
|
|
|
|
|
Broken clouds
|
|
|
|
|
|
|
|
Light rain
|
|
|
|
|
|
Ḷḷuarca weather by month / climate table
Max. Temperature °C | ø. Temperature °C | Min. Temperature (°C) |
Precip. (mm) |
Rainy Days (d) |
Rel. Humidity (%) |
|
|---|---|---|---|---|---|---|
|
January |
12.1 | 7.9 | 3.8 | 65.5 | 9 | 79.8% |
|
February |
11.5 | 7.6 | 4.2 | 10.5 | 5 | 78.9% |
|
March |
13.9 | 9.2 | 4.7 | 39.9 | 9 | 77.8% |
|
April |
15.7 | 10.6 | 6.2 | 66.8 | 9 | 79.2% |
|
May |
17.9 | 12.8 | 7.6 | 55.3 | 9 | 80.9% |
|
June |
20.6 | 15.8 | 11.2 | 33.6 | 4 | 82.2% |
|
July |
21.9 | 17.6 | 13.8 | 42.2 | 3 | 81.7% |
|
August |
22.4 | 18.2 | 14.7 | 44.1 | 3 | 81.1% |
|
September |
21.5 | 16.8 | 12.1 | 38.7 | 1 | 81.5% |
|
October |
19.3 | 14.3 | 10 | 16.9 | 0 | 79.7% |
|
November |
15.7 | 10.4 | 6.2 | 119.2 | 13 | 80.5% |
|
December |
12.8 | 8.6 | 4.8 | 22.6 | 5 | 79% |
Max. Temperature °F | ø. Temperature °F | Min. Temperature (°F) |
Precip. (in) |
Rainy Days (d) |
Rel. Humidity (%) |
|
|---|---|---|---|---|---|---|
|
January |
53.8 | 46.2 | 38.8 | 2.6 | 9 | 79.8% |
|
February |
52.7 | 45.7 | 39.6 | 0.4 | 5 | 78.9% |
|
March |
57 | 48.6 | 40.5 | 1.6 | 9 | 77.8% |
|
April |
60.3 | 51.1 | 43.2 | 2.6 | 9 | 79.2% |
|
May |
64.2 | 55 | 45.7 | 2.2 | 9 | 80.9% |
|
June |
69.1 | 60.4 | 52.2 | 1.3 | 4 | 82.2% |
|
July |
71.4 | 63.7 | 56.8 | 1.7 | 3 | 81.7% |
|
August |
72.3 | 64.8 | 58.5 | 1.7 | 3 | 81.1% |
|
September |
70.7 | 62.2 | 53.8 | 1.5 | 1 | 81.5% |
|
October |
66.7 | 57.7 | 50 | 0.7 | 0 | 79.7% |
|
November |
60.3 | 50.7 | 43.2 | 4.7 | 13 | 80.5% |
|
December |
55 | 47.5 | 40.6 | 0.9 | 5 | 79% |
February is the most draught at 0.4in / 10.5mm and November the month with the most rain around 4.7in / 119.2mm.
The avg. temperature is around 64.8°F / 18.2°C, August is the hottest month in a year. February is the coolest with 45.7°F / 7.6°C avg. temperature.
Activities & POI in Ḷḷuarca
| Type of Activity | List |
|---|---|
| Beach | Playa de Salinas, 1ª Playa de Luarca, Playa de Taurán, Playa de la Polea, Playa Portizuelu, 2ª Playa de Luarca |
| Attraction | Villa Barrera, Villa Cristina, Villa Excelsior, Villa La Argentina, Villa Rosario, Villa Tarsila |